|
Medical statistics (like all
statistics) can be confusing. Survival rates are often quoted using 5 year
survival numbers which report what percent of the patients with this cancer are
alive at 5 years (but does not mean, as some patients think, that you will only
live 5 years, nor does it mean that once you pass the 5 year mark, you are cured.)
Patients often want to know about survival odds when first diagnosed, but
survival is very dependant on how well the patient responds to treatment (go
here). Those patients whose cancer
responded well to therapy lives along time, those whose cancers did not
respond did poorly. It usually takes a few cycles of chemotherapy or weeks
of radiation to determine if the cancer is responding. Survival statistics may be quoted as absolute (how many people are really alive and kicking) versus relative or age adjusted survival (what percent are alive compared to the number expected.) So for 80 year old men with prostate cancer only 10% may die of the cancer over the next 5 years (90% relative survival) but since many die of old age and other causes, only 50% are actually still alive (50% absolute survival.) In fact of the 50% actually still alive, half of them may still have prostate cancer but it is so slow growing it will never effect their survival. So would you tell the 80 year old man his 'cure rate' is 90% or 50% or 25%?? |
When a patient wants to know
'average survival' he may be told the "median survival" which is
defined as the time point where half the people are alive and half dead. Sometimes the
patient or family fixate on this number, and eventually half the families will complain
that the patient died too early ("something must have gone wrong" or the
"doctors misled them") and half will remark that the patient lived much
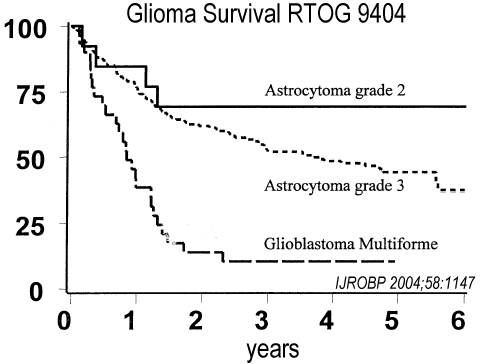
longer than expected (the "doctors were too pessimistic".) Also note that the most accurate way to describe survival is with a graph or survival curve that shows the data on all the patients ... note this is a continuous curve, so simply stating the median survival really only predicts the correct number for a very few individuals. Also note (as for the glioma graph below) that the exact type of cancer is critical (low grade gliomas do much better than high grade.) In fact, multiple details are critical (stage, histological type, response to therapy, etc.) Also often the most important factor in survival is not the cancer itself but the host (the health of the person with the cancer.) Patients who are very weak (low performance score or Karnofsky score) may do much worse, regardless of the stage or type of cancer. So consider all the complex variables before placing too much faith in a number that you read in a study or hear from the doctor (data here.) |
survival curve for all patients with glioma brain tumors from the RTOG (Radiation Therapy Oncology Groups Study) |
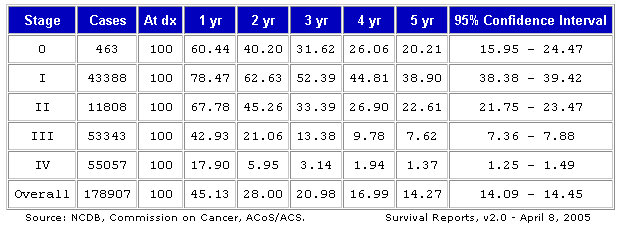
Five Year Survival Table and Survival Graph for Lung, Bronchus - Non-Small Cell Carcinoma Cancer Cases Diagnosed in 1995 & 1996 All States / Data Reported from 1707 Hospitals, number of patients was 178,907, note that survival is laid on a curve and 95% confidence levels are shown (which means that there is 95% chance the real number lies within the range shown.) If you are only one out of the 178,907 people can you pick out which dot or line represents you?? How does all this information help you predict the survival for an individual patient?? |